


Mixpanel Reviews & Product Details
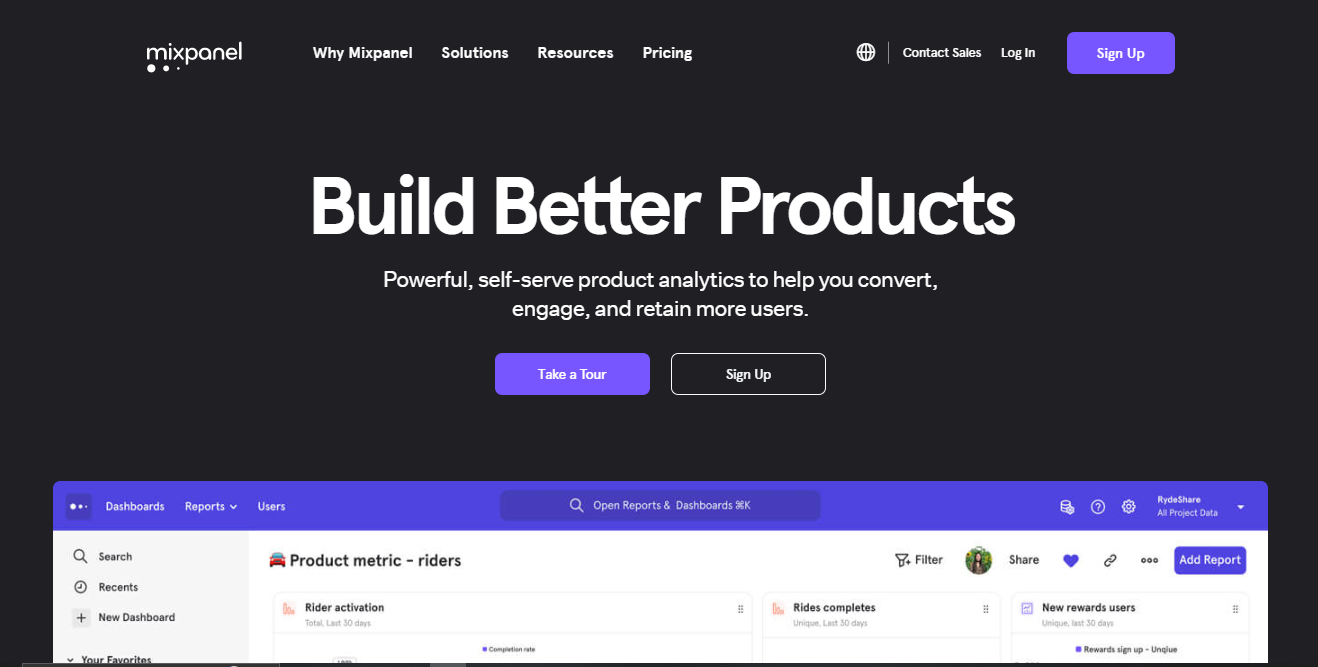
Mixpanel is an analytics platform used by companies to improve user engagement and boost retention through features such as behavior tracking, funnel analysis, and A/B testing with the intent of streamlining the user experience.

| Capabilities |
|
|---|---|
| Segment |
|
| Deployment | Cloud / SaaS / Web-Based, Mobile Android, Mobile iPad, Mobile iPhone |
| Training | Documentation |
| Languages | English |


1. Real-time insights: Mixpanel provides real-time insights into your user behavior, so you can make changes to your product or marketing strategy as needed. 2. Customization: Mixpanel is highly customizable, so you can tailor it to the specific needs of your business. 3. Integrations: Mixpanel integrates with a wide range of other tools, so you can easily get the data you need from all of your sources. 4. Scalability: Mixpanel is scalable, so you can easily add more users and data as your business grows.
My only concern is about the price as its freemium model is very good to give your business a good kickstart. But the price will grow exponentially as your app grows.
1. Mixpanel helps me to identify that a certain feature was not being used by many users. I removed the feature and replaced it with a new feature that was more popular with users. This resulted in an increase in user engagement. 2. Mixpanel helps me to identify that a certain marketing campaign was not effective. I changed the campaign and saw an increase in sales. 3. Mixpanel helps me to identify that a certain group of users was having trouble using my product. I made changes to the product to make it easier for these users to use. This resulted in an increase in user satisfaction.

Easy to get it! It's very intuitive do create dashboards and updates its as well.
Integrations with others plataforms are not easy to do it.
Our Saas indicatores (MAU, DAU,WAU) is totally controlled by the plataform.
Mixpanel has been an incredible asset for our business. Not only does it provide us with powerful analytics and insights, but their customer support is simply outstanding. Whenever we've had questions or needed assistance, their team has been prompt, knowledgeable, and incredibly helpful. Mixpanel is not only a powerful tool, but their commitment to excellent customer service sets them apart. Highly recommended!
While Mixpanel has proven to be an invaluable tool for our business, there is one aspect that could be improved. Occasionally, navigating through the interface can feel a bit overwhelming due to the abundance of features and options available. Simplifying the user experience and streamlining the interface would greatly enhance usability. Nonetheless, this minor inconvenience does not diminish the overall value that Mixpanel brings to our analytics efforts.
Mixpanel solves the problem of fragmented data by allowing us to fuse data from different channels into one unified platform. This capability is immensely beneficial as it enables us to cross-reference data and gain a comprehensive understanding of our users' journey. By having a centralized view of our users' interactions across various touchpoints, we can analyze their behavior, identify patterns, and make data-driven decisions to optimize our products and services. Mixpanel's ability to provide a holistic view of the user journey has greatly enhanced our understanding and engagement with our audience, leading to improved customer experiences and better business outcomes.
The documentation is really well thought through. The implementation of mixpanel was very straightforward. It was a few functions we had to call and the data was being collected.
The report and finding the right data can be abit confusing. I did struggle abit and had to get assistance from a mixpanel expert on upwork to assist me.
We were struggling to understand our product analytics, how our users were using our product. Mixpanel was able to provide us with all the insights, we really improved our matrics after we understood what our users were doing on our platform.
Its collection of data and simplifies it to provide it to the users. It's unmatched. The recording of events by the user on the application. Havent tested competitors, but I wouldn't switch from Mixpanel.
Nothing for now, all looks good. nothing wrong at all. Nope, I don't think so. No problems at all. I would like them to continuously improvise.
I can see the data and easily assist the user, watch the events of user on the smallcase app. Yes, I am definitely more productive than ever. Yes business performance has increased.
1. Easy to implement. 2. Easy to analyze and extract beneficial insights 3. Flexible and straightforward at the same time
Nothing, I just love and and can't think of anything that I dislike.
1. User behavior analysis 2. AI performance analysis 3. Retention and growth hacking
No need to think twice from the perspective of grouping or limiting events. Log all interactions as they happen, and let Mixpanel insights give you the summary you need. Funnels and Retention reports also help a lot. Because of the simple interface, you can get insights very quickly.
They provide some board templates, but I guess that's where they can improve and add more ready-to-use templates. May be I haven't explored this part enough, will soon give it a try.
It solves the simple problem of gaining insights into user behavior, satisfaction and retention without interrupting the user. I spend way less time making sense of analytics now.
It has to be the amazing customer service. I've never had a question that went unanswered for a long time. I work with over a dozen vendors like MixPanel on a regular basis and none of them compare.
Nothing really. I do have a suggestion though - I'd love it if we could leverage AI to identify and duplicate (or similar) events/properties, in order to avoid redundancies.
MixPanel allows me to keep track of dozens of features/products, always ensuring optimal UX, and preventing any unwanted anomalies. Without MixPanel I would be lost.
It has given me every insight I want on my users, and so far, I've only used the free tier features. It's a rare product I'd be happy to pay for, and it's been free so far.
I wish it were easier to track an individual user's session and only see the values you want when viewing a user's activity. It'd also be nice if the documentation were a little more specific on how to add custom attributes.
I wasn't sure how users were using my product, and now I'm not flying blind when figuring out what features to add and where people are getting hung up when using the product.
Mixpanel helped me review all important analytics for the mobile app i was working on. I was able to review data, create flows and funnels. Being able to do this was so helpful in visualizing what was going on in my app.
The learning curve was a bit steep and understanding how to use some of the graphs/data was hard. So it took some time to watch tutorials and read the documentation to learn how to use all of the features.
The problems mixpanel solved were endless. I could look at daily, yearly, and monthly data on what was going on in my app. I was able to create reports to understand user flows.
1. It is super fast - No matter the complexity of filters, breakdowns, mixpanel comes up with the visualization in a jiffy. Now that's a delight because number crunching is known to be super slow process across other analytics tools, excel etc. 2. The UI is beautiful - Who thought number crunching could be fun? Well, mixpanel did. 3. Feature packed - You get trends, insights, funnels, cohorts broken down by any number of dimensions.
Nothing really! Maybe they could add products like Appcues, Userflow etc., to simplify life for product folks.
Super detailed view of User behavior, feature adoption, engagement, conversion & retention. Integrates most of external tools seamlessly as well.
I find Mixpanel so user friendly compared to other analytics tools. You don't need to be an expert or SQL wizard to get useful insights. The charts are easy to generate and understand, and the dashboard sharing and AB testing capabilities are awesome.
I can't really think of much. Some user flows are a little bit unintuitive like setting up custom events, but it's pretty easy in general and more than flexible enough for my needs.
It makes it easy to track performance of features, AB tests and user cohorts, so i know if the work we're doing is succeeding with the expected impact. The whole team can also get involved as it's easy to use.
The mix-panel gives the ability to track the user's path fro which he had gone through. The mix-panel gives all the info. relate to the user, how he used the app, from where etc. This allows an org. to debug the errors faced by the users and helps in future progress development.
Not as such, but i would recommend adding some more integrations in mixpanel for other apps.
Mixpanel is trying to compete with google analytics and for that mixpanel needs to be more precise with more fields to be added on so that the org. Can get more such info related to the user.
- mixpanel is one great solution, for tracking customers data and analyse
- customer support can be improved. - Pricing can be msde more transparent.
- Mixpanel makes it easy to know customer behaviour with the actual product and analuse the details well.
I really love the user interface of the software. It is very easy to use and one can easily extract insights to get to know about the overall activities which are happening on the app and use this to grow the app.
Not really anything specific. But, it sometimes delays showing the data which hampered the real-time data analysis. It would be an issue for those who would like to know the app's performance on a real-time basis.
We are in the business of providing news through memes. We wanted to see the different metrics like post views, likes, shares etc. to get a better understanding of whether the people are loving our app or not. Mixpanel provides all this data which helps us to get the data easily from one software. Now, we don't need to go on other software to get the same data.

- Very quick to get started - especially if you have a development team in-house. I think for us, we were up and running in a few hours (with some essential first events) - I feel that I am, for the first time, able to do good, data-driven product management - There are very few questions on the data I have that I can't answer with Mixpanel. Its highly configurable
- It feels like statistical data does not work so well with Mixpanel. With that, I mean data that is not an event from Users - for example, how long an upload takes,... - It would be great if Mixpanel could also send surveys to customers directly in-app. For example, NPS surveys or similar...then the NPS score could be directly linked to the user in Mixpanel...allowing quite powerful analytics
- Making better, data-driven decisions - Understanding product and feature usage and reacting to it in real-time - Making our actions and objectives more quantifiable
Easy to learn, easy navigation, multiple filters to narrow down metrics of experiments, customizable according to time, and many data metrics, different types of charts to refer to like funnels, charts etc.
Nothing as such, sometimes data inaccuracy happens, but that is a rare case. It takes time to learn initially, like a week or 2, but once somebody is thorough with the basics then it is easy to operate every day.
Measuring the success of experiments of our product, measuring data by knowing the dropoffs at every stage, it also tells about user engagements at every step by time, number of sessions and also the geography of the users.
The graphical representation and variety of filters
Sometimes, it's difficult to understand what the feature or new feature is about
Availing us at Free Now to compare results of A/B testing
Mixpanel is undoubtedly the best tool for product analytics, especially if you have a SaaS platform. I use it in every project. Its 4 types of reports allow you all the flexibility to show complex data in a simple way. Its interface and ease of use, unlike other tools, makes the learning curve incremental and virtually anyone on the team with minimal knowledge can get the most out of it.
Previously there was a solution to send in-app messages and emails from the platform itself. The truth is that I liked it a lot, but I understand the decision to eliminate it because it was practically a different product. There is nothing I don't like about it.
I can extract the data I want from my software and easily display it in attractive charts and dashboards that the whole team can use and understand. Used in conjunction with Segment, the results and ease of implementation are incredible.
The UI is super intuitive - even with a ton of data I am able to pull the insights I need to inform decisions. But the best part is my ability to easily share those insights with others.
Sharing insights is an important part of my company's MixPanel experience. The permissions settings are tucked away and often forgotten about. I ran into a situation where I created all my insights & dashboard but didn't want to share until they were complete. When it came time to share I had to individually go into the permissions for each insights to invite. A bulk share/invite users to view all the things I created would be useful
Tracking usage of our clients on our product. Before MixPanel this data and information was blind to us. Now we can rely on actual numbers vs. qualitative data and feedback on usage.